Gabriel Fjord Status
A friendly public page for Bergen's Gabriel buoy, turning fjord measurements into plain words, charts and a tram screen.
Context
Gabriel is a measuring buoy in Store Lungegårdsvann, the fjord basin in the middle of Bergen. Since 2015 it has lowered a CTD from the surface to the bottom every three hours, measuring temperature, salinity, oxygen, turbidity and algae. The data is open, but it lives in spreadsheets and charts made for researchers.
UiB's Hackathon Store Lungegårdsvann (31 October 2026) asked for ways to make people care about the fjord, with Gabriel's data as the suggested focus. I sketched this page before the event, said so when presenting, and built on it during the day. The judges asked a lot of questions about it, and it shared the prize.
Gabriel Fjord Status screenshots
01 / 07Start — Gabriel greets the visitor
Try it
It runs live at gabriel.sekke.dev, in Norwegian and English:
- The fjord status page, with the summary, heatmap and explanations.
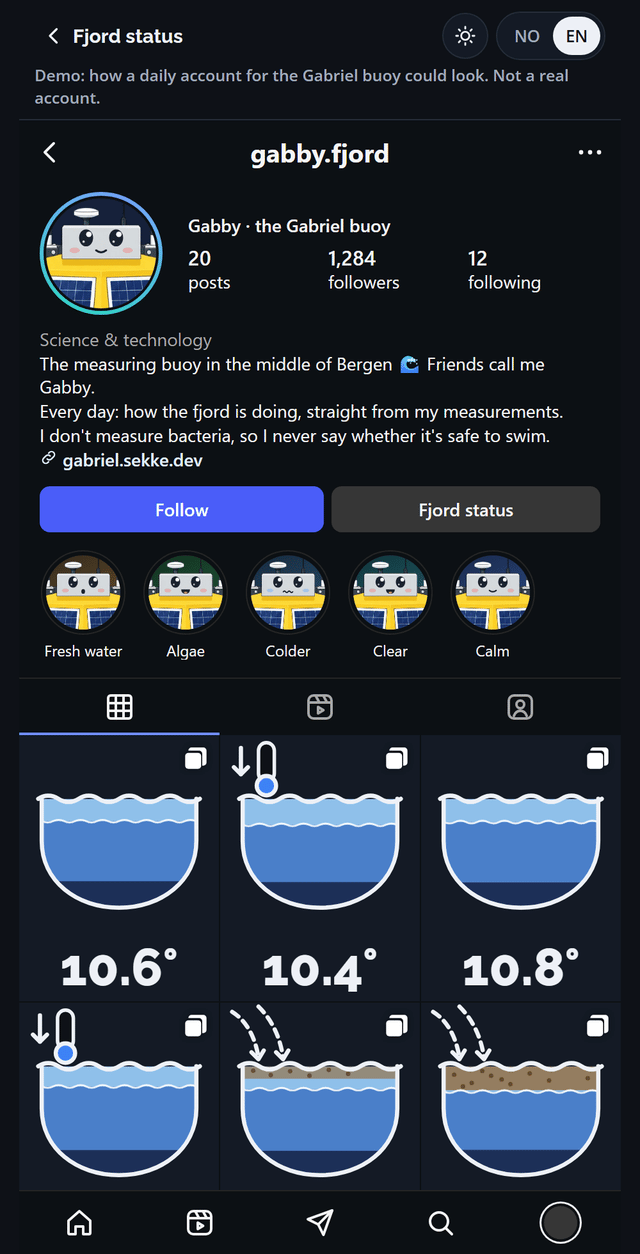
- Gabby, the demo daily account.
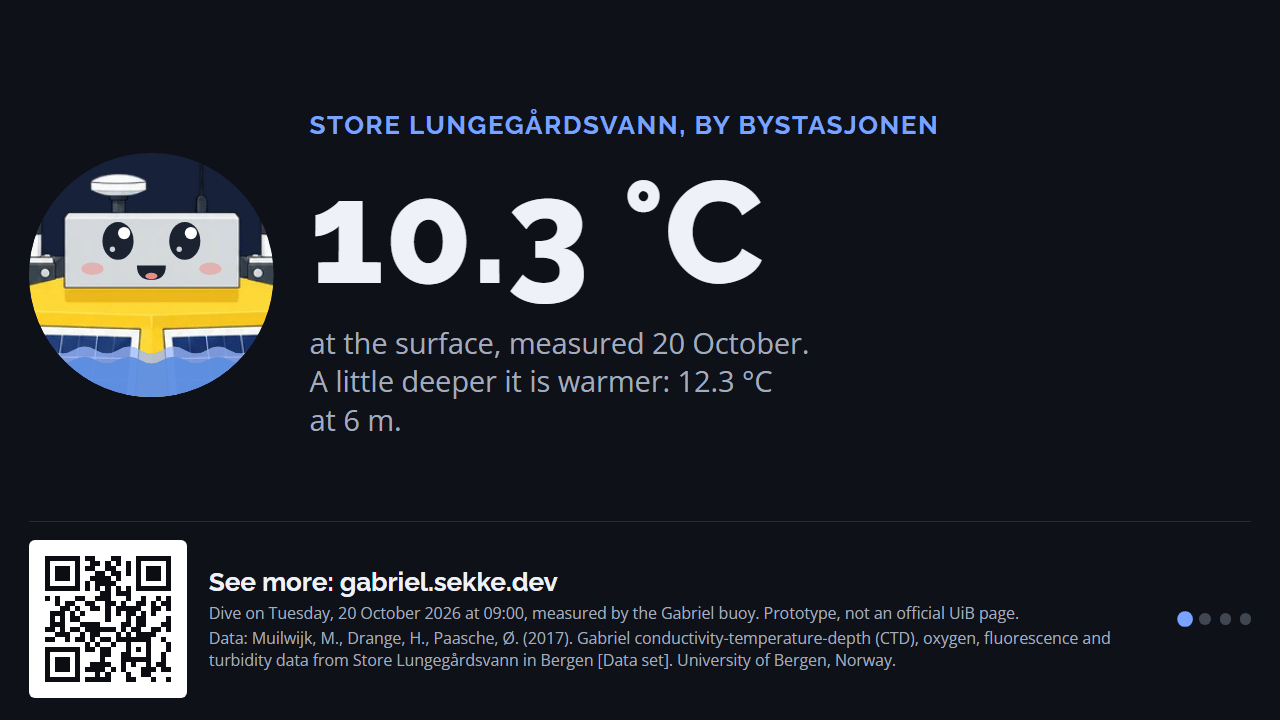
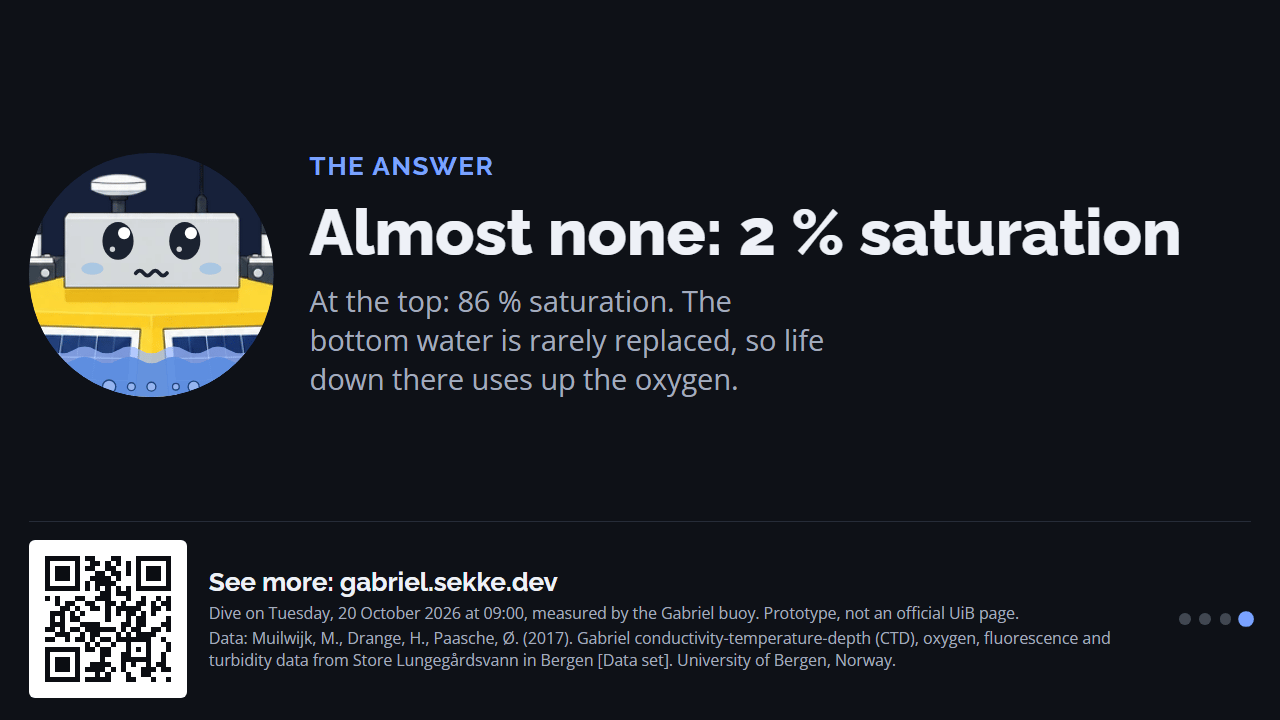
- The Bybanen screen, which changes slide every 8 seconds; the arrow keys step through it.
- A dive replay, Gabriel lowering its instrument through the latest real dive.
What I built
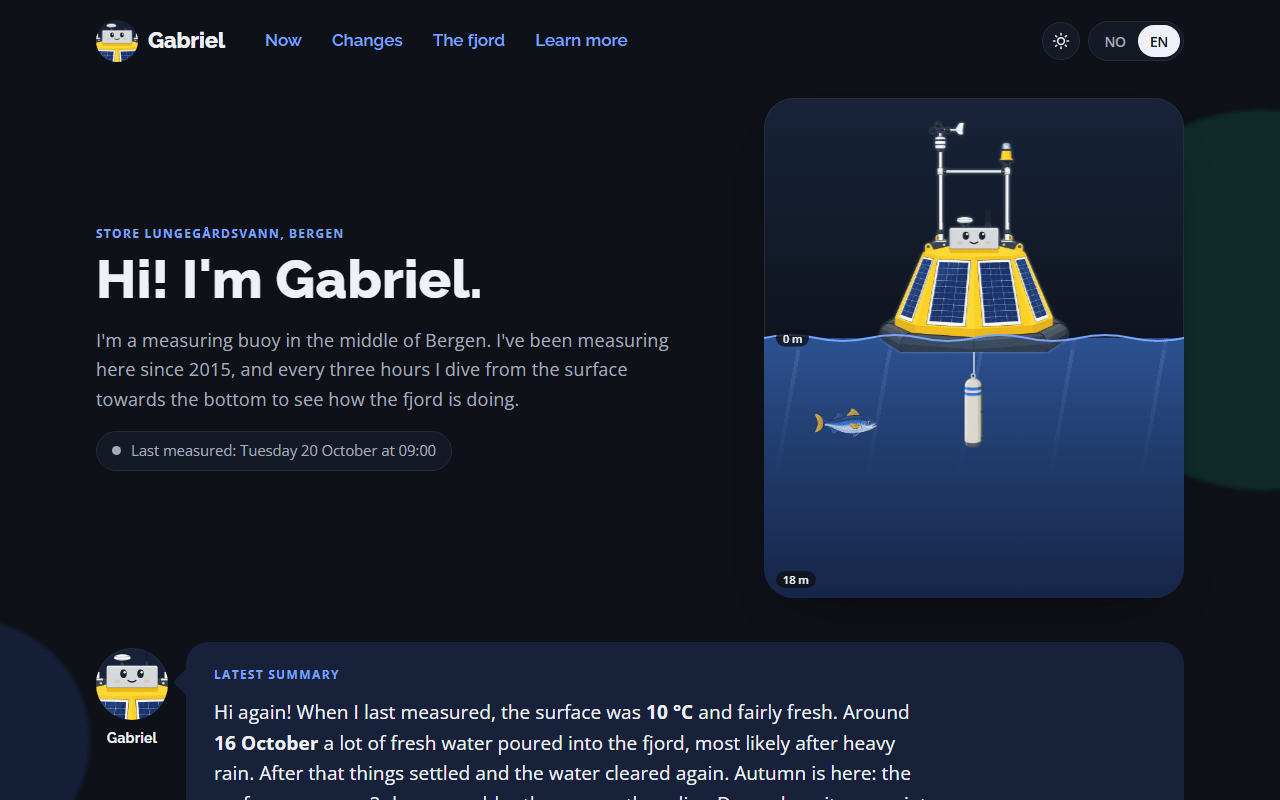
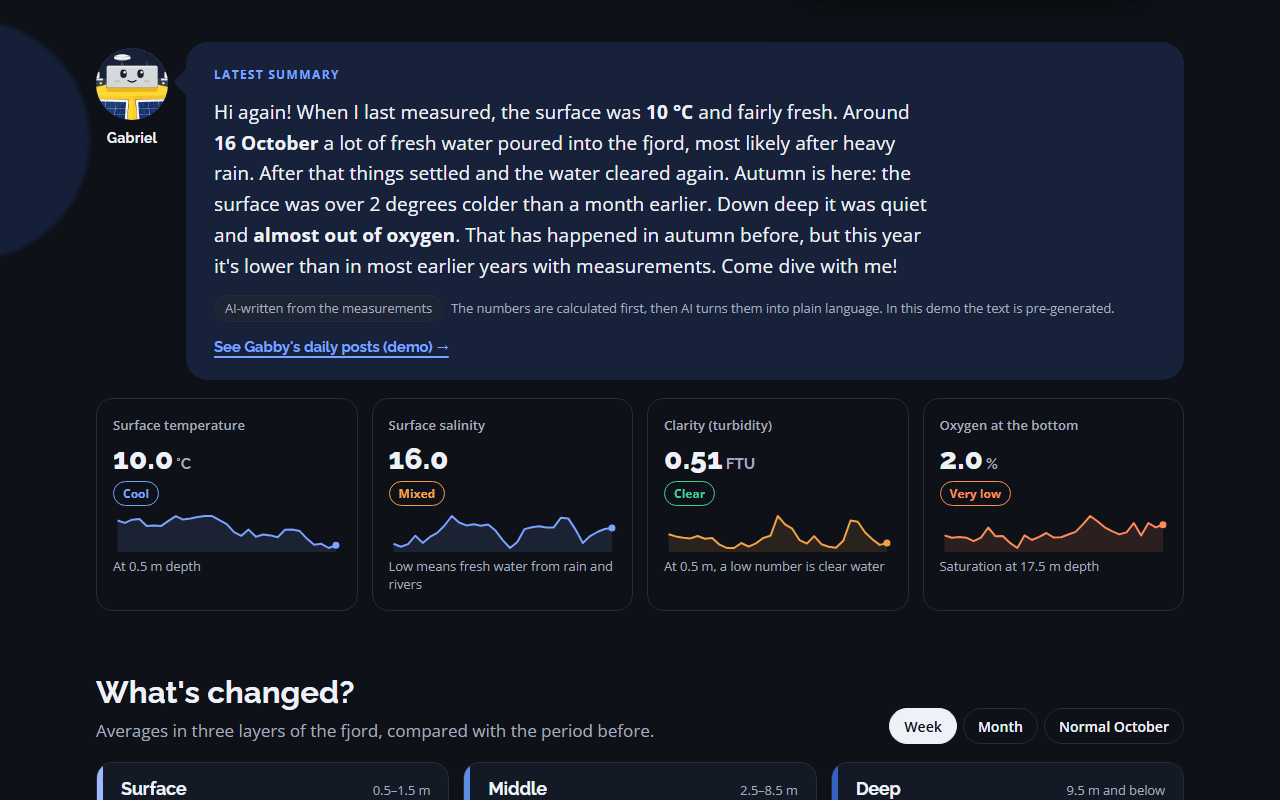
- A fjord status page where Gabriel greets the visitor and sums up in a few sentences how the fjord is doing, with summary tiles and sparklines, and what changed over the last week, the last month and compared with a normal October.
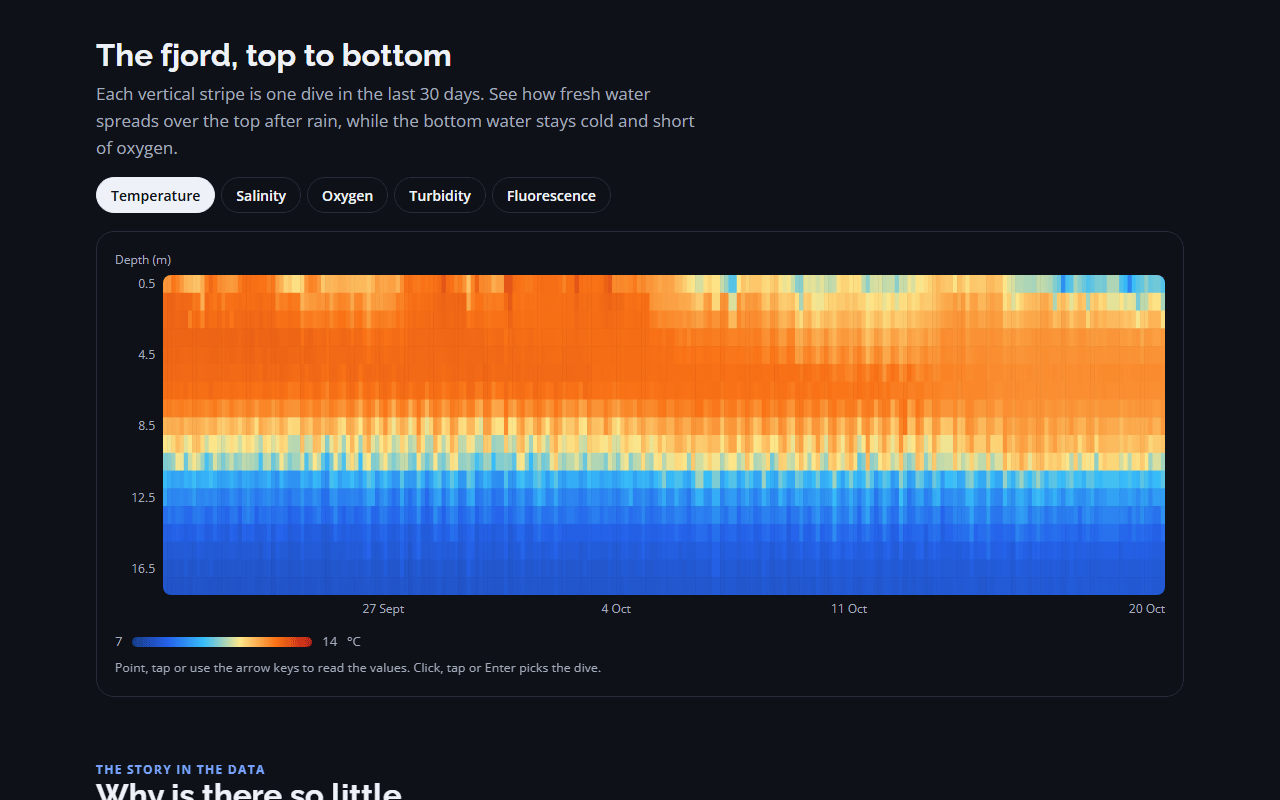
- A 30-day depth-by-time heatmap of every dive, for each measurement. Hovering reads the values; a click, tap or Enter picks a dive and shows it in the summary tiles.
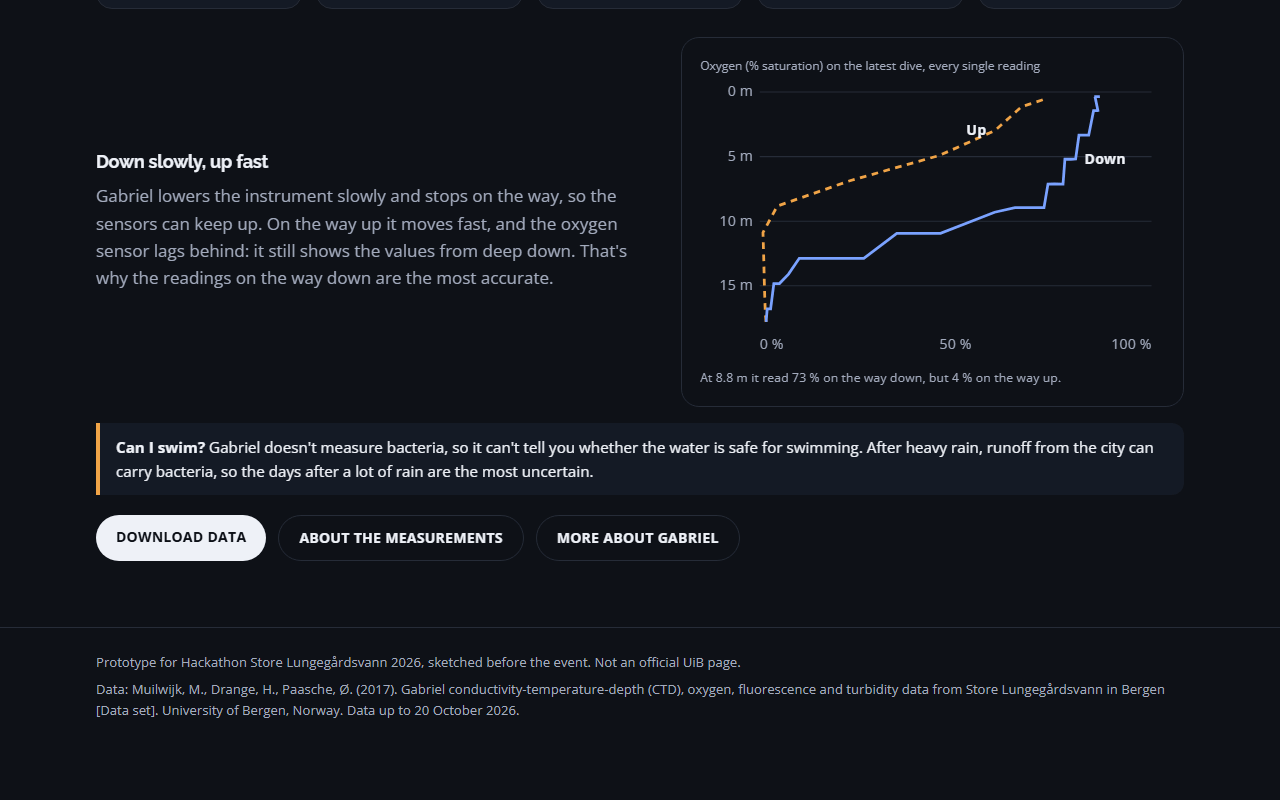
- Plain explanations: why the bottom water runs out of oxygen, what each measurement means, and a chart of the latest dive going down and coming up. The instrument descends slowly and comes up fast, so the oxygen sensor lags on the way up: at 8.8 m it read 73 % going down and 4 % coming up.
- "Gabby", a demo of the organisers' idea of a daily social account. Every post is computed from that day's dives: a mood from fixed rules, a caption from templates, and a picture of the fjord as a bowl painted from the day's profiles.
- A silent screen for Bybanen, the city's light rail, where people look for a few seconds and can't touch it. Big one-fact slides about the rain lying on top of the fjord and the oxygen at the bottom, Gabby's face, and a QR code to the page.
How it's built
- Facts first, words second. A Python and pandas script reduces eleven years of 1 m depth bins to the compact JSON the pages use. Every number, comparison and threshold is computed in code; the text only phrases it. In the demo the summary is pre-written from those numbers. The plan is for a language model to phrase them, with the result cached per dive.
- One file per page, no network. Each page is plain HTML, CSS and JavaScript with no framework. A small build script inlines the data, fonts and illustrations, so every page is one self-contained file served by a static Cloudflare Worker under a strict Content Security Policy.
- Honest about the data. Gabriel doesn't measure bacteria, so nothing ever says it is safe to swim. Turbidity and algae aren't compared across years because the sensors changed. Every page cites the dataset.
- For everyone. Norwegian and English, light and dark, phone to wide screen, keyboard support, and every animation off under reduced motion.
Result
Live at gabriel.sekke.dev. It shared the hackathon prize after a presentation that drew a lot of questions from the judges.
Honest status: a prototype with data up to 20 October 2026. There is no live feed yet, the Gabby account is a demo rather than a real profile, and the Bybanen screen hasn't run on a real tram screen.